Blog Layout

What is Market Volatility and What Does it Mean?

Apr 09, 2021

Volatility as a Statistical Term

Simply put, volatility is the degree to which a stock varies from its average price. This means that a stock that is highly volatile will often move up or down in price very quickly whereas a non-volatile stock will rarely deviate from it's moving average.


Having a low volatility does not necessarily mean that the stock is not profitable. In fact, many low-volatility stocks are very profitable over time and many high-volatility stocks either lose or simply retain value over longer periods of time. Volatility is not a measure of profitability, but rather, a measure of variance around the trendline.


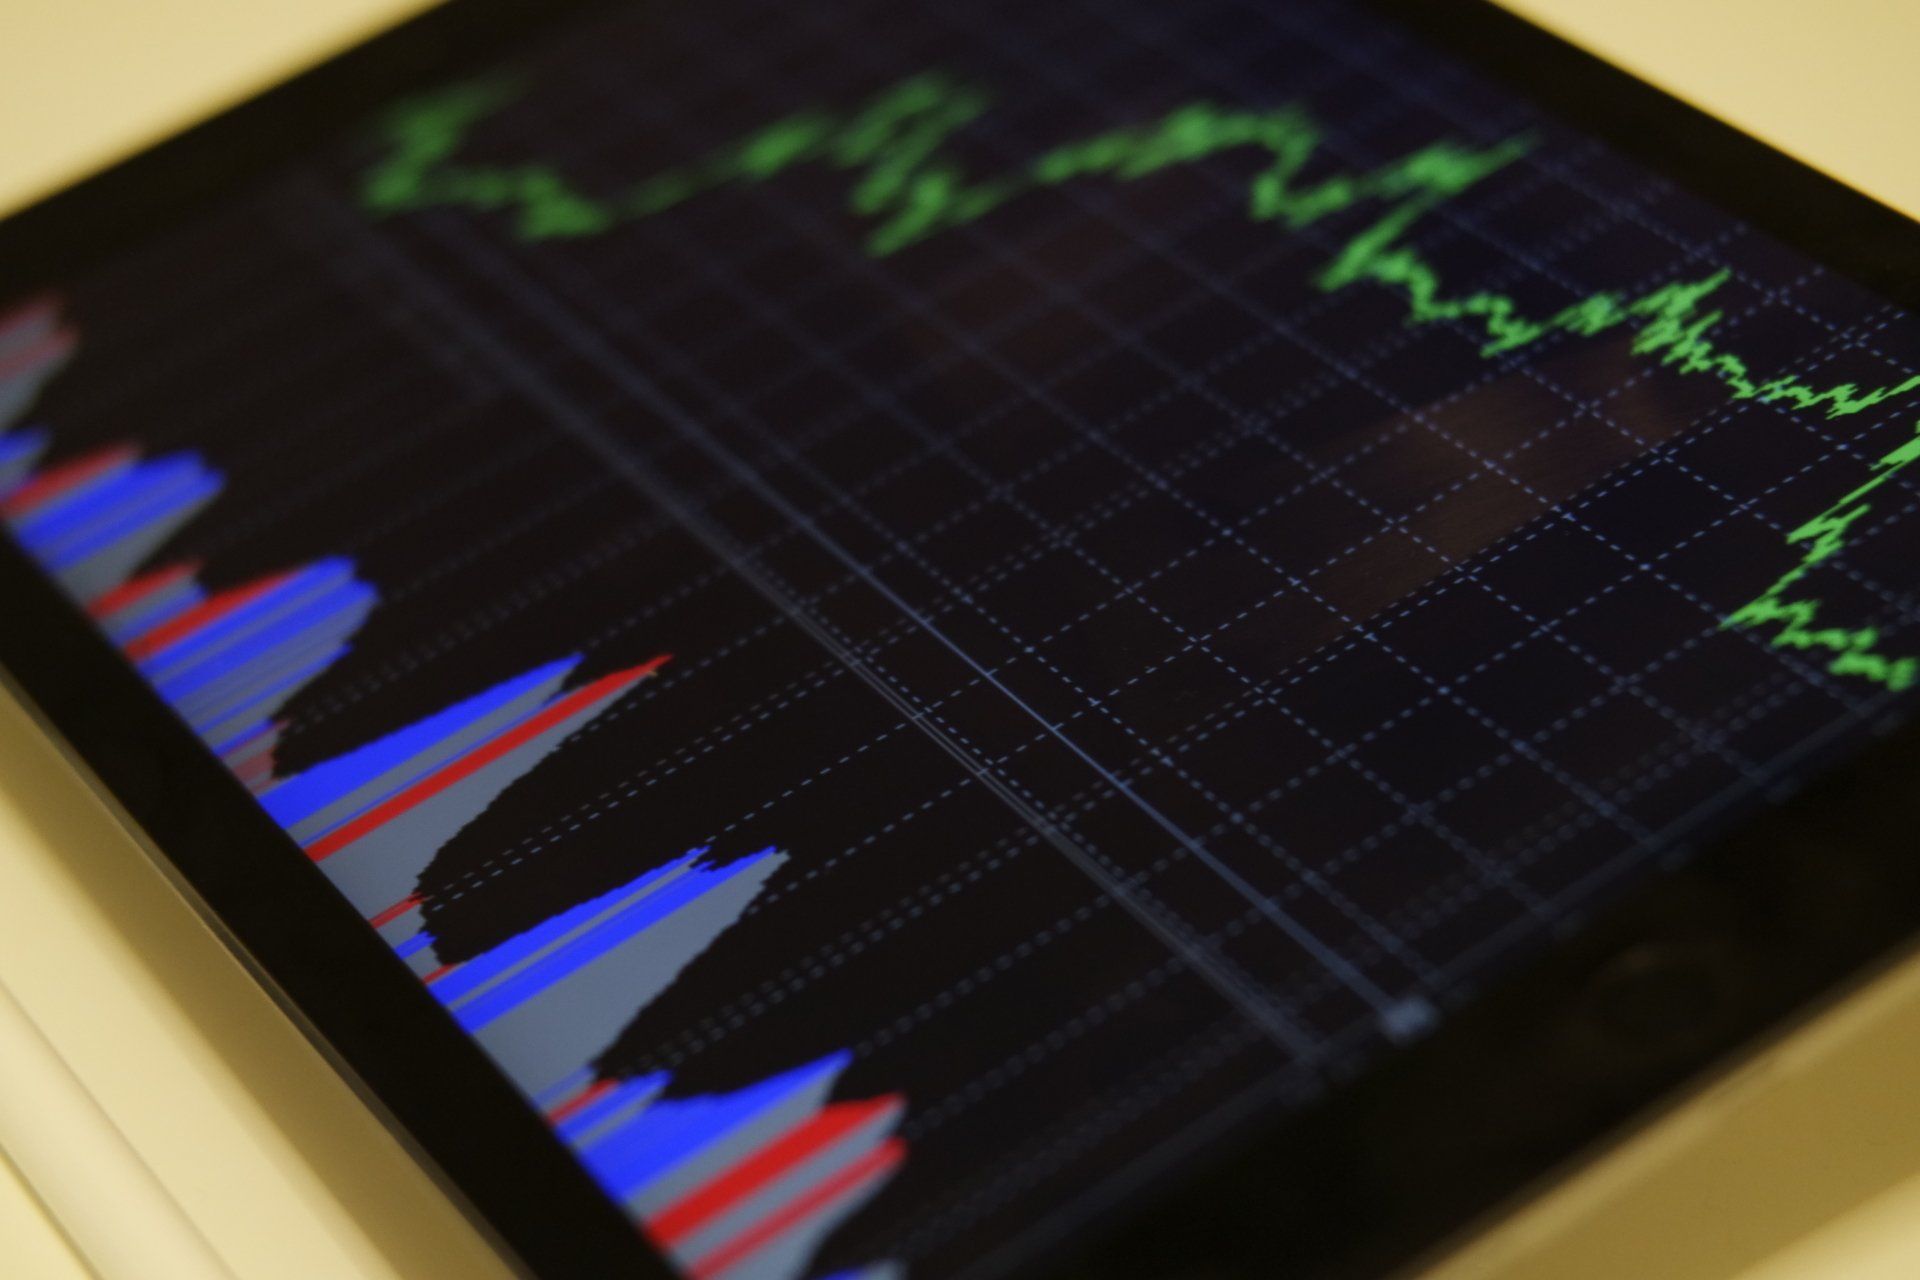
Below, in Figure 1.1, a profitable, but low-volatility stock is pictured. Notice how the stock's price (green line) stays relatively near to its trendline, or moving average price (pink line). This is the definition of a stock that is not very volatile.

Figure 1.1 - A low-volatility stock is easily recognizable as it rarely deviates far from its trendline

What Does Volatility Look Like?

Now that we've defined volatility, let's talk about how to recognize it. Linear trendlines (the pink line shown in figures 1.1 and 1.2) are a simple visualization of the average value of the dataset over time. They are always straight, which makes them easier to visualize. In a pinch, you can draw a straight line, anchored to the first data point and then move the right end of the line up or down until it sits as evenly as possible amongst the rest of the dataset.


Now that you have your trendline, you can compare it with the dataset. Are there large spikes up or down, away from the trendline? If so, you've just identified an area of higher volatility! Now that you've visualized that process, take a look at Figure 1.2 and see if you can identify the points of higher volatility/.

Figure 1.2 - A high-volatility stock is also easily recognizable as data frequently and erratically diverges from the trendline. Stocks can be highly volatile and still have a relatively flat trendline as pictured above.

Market-Wide Volatility

Just as we can evaluate volatility for an individual stock, we can evaluate volatility for an entire industry or sector, entire index, and even the entire stock market! There are numerous methodologies for doing just that, but the one we'll focus on today, is The Chicago Board Options Exchange's (CBOE) VIX Index. The VIX Index is a measurement tool that reflects expected volatility in the S&P 500. The ticker symbol for the index is: VIX, but it may be worth noting that the index is non-tradeable as its price is meant to be used as a measurement tool. 

So Why Does Volatility Matter?

Experienced investors often consult market conditions (including volatility) as they make investing decisions. As investments are, by nature, forward-looking, indicators such as volatility can help investors predict general market movements and growth. Though there are no perfect instruments in diving the future, the VIX has helped many investors get on the right side of upcoming market volatility.


Remember the integral relationship between risk and reward, being; More Risk = More Reward. Any period of increased volatility in a stock or market is a time of increased risk (therefore, an opportunity for increased gains/losses). Interestingly, a recent study put out by Crestmont Research found that increased volatility corresponds to an increased probability of a declining market, while decreased volatility corresponds to a higher probability of a rising market. In simpler terms, volatility generally points to a declining market.

A five-dollar bill sits on a wooden surface.
23 Jun, 2022
Five things that you will want to know before you start investing.
Three dice spelling NFT sit on top of a computer chip and a pile of money.
10 Jun, 2022
A starter's look at NFT's and whether they are worth investing in.
08 May, 2022
Entering the world of investing is always exciting, but sometimes the dream turns into a nightmare when expectations don't meet reality. In this article, we discuss what new investors might want to know before diving in head-first.
07 May, 2022
StockMotion is an app that teaches financial literacy and is available for free on both the App and Play Stores. In this article, we highlight the investing basics curriculum that walks players through the fundamental concepts of investing and serves as a great starting point for your investing journey!
paper version of a retirement plan
06 May, 2022
Depending on your age, retirement may seem a long way off in the distance, but failing to have a specific goal and plans to reach it will likely cause your retirement to be stressful or delayed altogether. In this post, we'll take a look at what a retirement plan is and how you can get started on your own plan!
21 Apr, 2022
We all notice when prices go up, but what causes that rise in price? How is inflation calculated? Is it always a bad thing?
Paper with charts next to an open laptop
14 Aug, 2021
We know that talking about investing and the stock market can sometime sound like an alien language. The term, P/E ratio, is not any different sounding like jargon but it's actually a simple concept once we break it down. First off, let's talk about the P/E, it stands for Price-to-Earnings. More specifically, price refers to the stock price of the share and earning refers to, well, the total earnings of the company divided by the outstanding shares. Note: outstanding shares means the total number of shares issued by the company which include shares kept within the companies and owed by the shareholders, us. So for example, the company Good Food store has a stock price of $1. Over the past month, Good Food store earned $100 and it has 200 outstanding shares. So P or Price which is just stock price = $1. So for E or Earning, we take the $100 earned and divide it by the 200 shares, equalling .5. To finish calculating the ratio we have to divide P/E or $1/.5 which turns out to be 2. So we are left with a P/E ratio of 2. Now what? Well, it depends.
A small plant grows out of a pot filled with saved money
09 Aug, 2021
401(k). It’s one of the most common ways to save for retirement, but how do you know which kind to invest in? This is a frequently asked question, especially among young people just starting out their careers in companies that offer retirement benefits. To start off, let’s talk about what a 401(k) actually is. Luckily, 401(k) is not referring to a long-distance race (I think far fewer people would be interested in it if it were). It’s just a retirement savings/investment tool that was named after a section of the U.S. Internal Revenue Code. Typically, if you invest in a 401(k) through your employer, your money will be managed by an advisor, often from some sort of investment management company like Fidelity. That’s not to say that you don’t have any say in how your money is invested--you certainly have input over your own money. Many companies allow employees to contribute part of their paycheck to a 401(k). Some companies even offer to match their employees’ contributions, up to a certain percentage. As of 2021, the max amount that can be contributed to a 401(k) in a given year is $19,500 for employees under 50-years-old and $26,000 for employees who are 50 years of age or older. That extra $6,500 for employees over 50 is called a catch-up contribution. It allows said employees to more easily meet their retirement goals as they draw closer to it. So, when that percentage of your paycheck gets taken out, where exactly is it going? The money that is invested in a 401(k) will generally include an array of stock and bond mutual funds, as well as target-date funds. The specific makeup will depend on a few factors, one of the most important ones being how close you are to retirement (the closer you are, the lower the risk because you won’t be playing the long game in the stock market anymore). With all of this information about 401(k)’s, how do I know which kind to invest in? That decision is going to depend on personal preferences, but what you need to know about the differences between a Roth and a Traditional 401(k) comes down to how they are taxed. Contributions to a Roth 401(k) are taken from after-tax dollars. That means you are investing money from your paycheck that has already been taxed and don’t have to worry about paying taxes on it (or its growth) when you withdraw money from it in retirement. One thing to note is that your employer match portion in a Roth 401(k) will be subject to taxes when withdrawn. Contributions to a Traditional 401(k) are taken from your paycheck’s pre-tax dollars. That means that your taxes will be lower now, but you will pay taxes on everything you withdraw in retirement. When they are withdrawn, they will be taxed at an ordinary income tax rate, with most state income taxes applying as well. So, which type of 401(k) to invest in comes down to you. Do you think income taxes will be higher today or during retirement? Do you think you will be making more money now or later? Now that you have an understanding of the differences between the two, these are just some questions to consider when deciding on a Roth vs Traditional 401(k). Citations: Dave Ramsey, “401(k) vs. Roth 401(k): Which One Is Better?,” Ramsey Solutions (blog), June 17, 2021, accessed 8/3/2021, https://www.ramseysolutions.com/retirement/traditional-401k-vs-roth-401k . Jason Fernando, “401(k) Plans: The Complete Guide,” Investopedia, March 11, 2021, accessed 8/3/2021, https://www.investopedia.com/terms/1/401kplan.asp . Kristin McKenna, “Should I Pay Someone to Manage My 401(k)?,” Forbes, February 22, 2021, accessed 8/3/2021, https://www.forbes.com/sites/kristinmckenna/2021/02/22/should-i-pay-someone-to-manage-my- 401k/?sh=b6dd3eed0673 .
skydiver
19 May, 2021
Risk tolerance is a term that gets thrown around a lot in the investing world, but have you ever wondered how to determine your own risk tolerance? There are a few questions that go into it, but the most simple one is the most important.
Screen showing many stock charts and prices in a grid layout
18 May, 2021
Did you know you have access to Tesla's revenue, expense, and profit numbers? Click here to learn how to find financial reportings data for any publicly traded company in minutes. Become a pro at navigating the SEC's Edgar tool today!
More Posts
Share by: